Duplicated Headcount by Academic Term (2010-2015)Top
Duplicated Headcount by Academic Term (2010-2015)Top


Unduplicated Headcount by Academic Term (2010-2015)Top
Unduplicated Headcount by Academic Term (2010-2015)Top


Headcount by Age Range (2010-2015)Top
Headcount by Age Range (2010-2015)Top


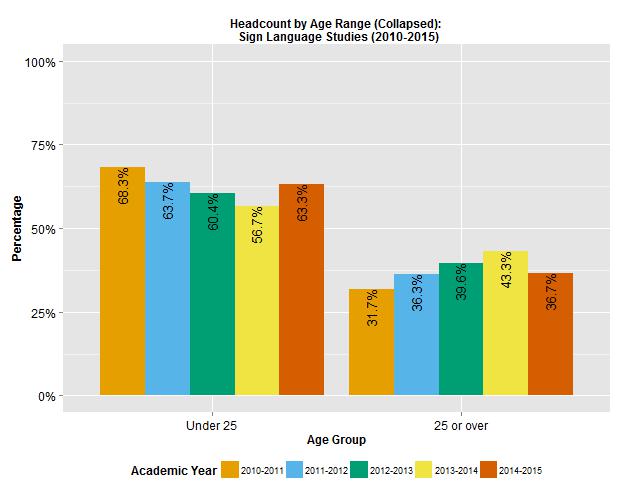
Headcount by Age Range (Collapsed) (2010-2015)Top
Headcount by Age Range (Collapsed) (2010-2015)Top

Headcount by Gender (2010-2015)Top
Headcount by Gender (2010-2015)Top


Headcount by Ethnic Group (2010-2015)Top
Headcount by Ethnic Group (2010-2015)Top


Headcount by Educational Goal (2010-2015)Top
Headcount by Educational Goal (2010-2015)Top


Headcount by Educational Level (2010-2015)Top
Headcount by Educational Level (2010-2015)Top


Headcount by Instructional Mode (2010-2015)Top
Headcount by Instructional Mode (2010-2015)Top


Headcount by Course Level (2010-2015)Top
Headcount by Course Level (2010-2015)Top


Headcount by Freshman Status (2010-2015)Top
Headcount by Freshman Status (2010-2015)Top


Headcount by Primary Language (2010-2015)Top
Headcount by Primary Language (2010-2015)Top


WSCH by Academic Term (2010-2015)Top
WSCH by Academic Term (2010-2015)Top


ESTIMATED FTES by Academic Term (2010-2015)Top
ESTIMATED FTES by Academic Term (2010-2015)Top


FTEF by Academic Term (2010-2015)Top
FTEF by Academic Term (2010-2015)Top


Productivity (WSCH/FTEF) by Academic Term (2010-2015)Top
Productivity (WSCH/FTEF) by Academic Term (2010-2015)Top


Student to Faculty Ratio (ESTIMATED FTES/FTEF)Top
Student to Faculty Ratio (ESTIMATED FTES/FTEF)Top


Success Rate by Academic Year (2010-2015)Top
Success Rate by Academic Year (2010-2015)Top


Success Rate by Age Range (2010-2015)Top
Success Rate by Age Range (2010-2015)Top


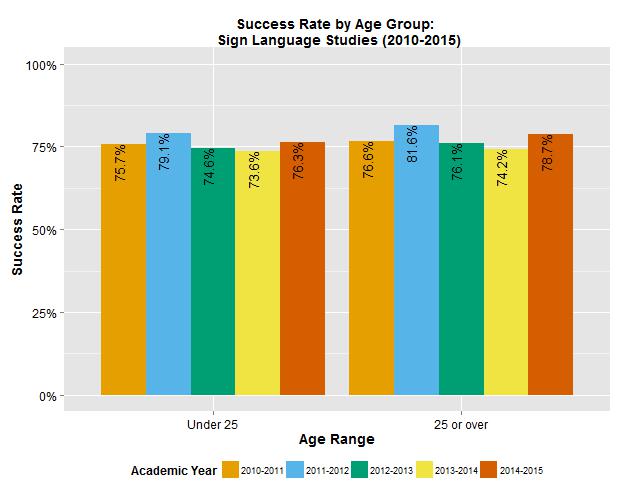
Success Rate by Age Group (2010-2015)Top
Success Rate by Age Group (2010-2015)Top

Success Rate by Gender(2010-2015)Top
Success Rate by Gender(2010-2015)Top


Success Rate by Ethnic Group (2010-2015)Top
Success Rate by Ethnic Group (2010-2015)Top


Success Rate by Educational Goal (2010-2015)Top
Success Rate by Educational Goal (2010-2015)Top


Success Rate by Educational Level (2010-2015)Top
Success Rate by Educational Level (2010-2015)Top


Success Rate by Instructional Mode (2010-2015)Top
Success Rate by Instructional Mode (2010-2015)Top


Success Rate by Course Level (2010-2015)Top
Success Rate by Course Level (2010-2015)Top


Success Rate by Freshman Status (2010-2015)Top
Success Rate by Freshman Status (2010-2015)Top


Success Rate by Primary Language (2010-2015)Top
Success Rate by Primary Language (2010-2015)Top

